
Not Quite Gold, but Close
I had something completely different planned for today that will blow people's minds, but decided I wanted to get a little bit more information before running it, just to cover all bases. That will come later this week.
So today we are talking pavement... or lack thereof.
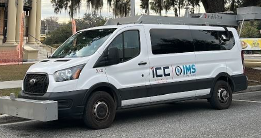
Tomorrow, the BOCC will hear a presentation by Mott Macdonald, our consultant on our road network. We paid them approximately $1 million to drive the roads with their lidar system to scan them and create a model for us to use to guide our road maintenance program. We are also getting software that will allow us to input various variables to help us put together a plan to maintain the roads.
The tech geek in me finds this interesting. If nothing else, the vans look cool.
Ok.. back on the road. (I crack myself up).
This system uses the following chart to classify our roads.
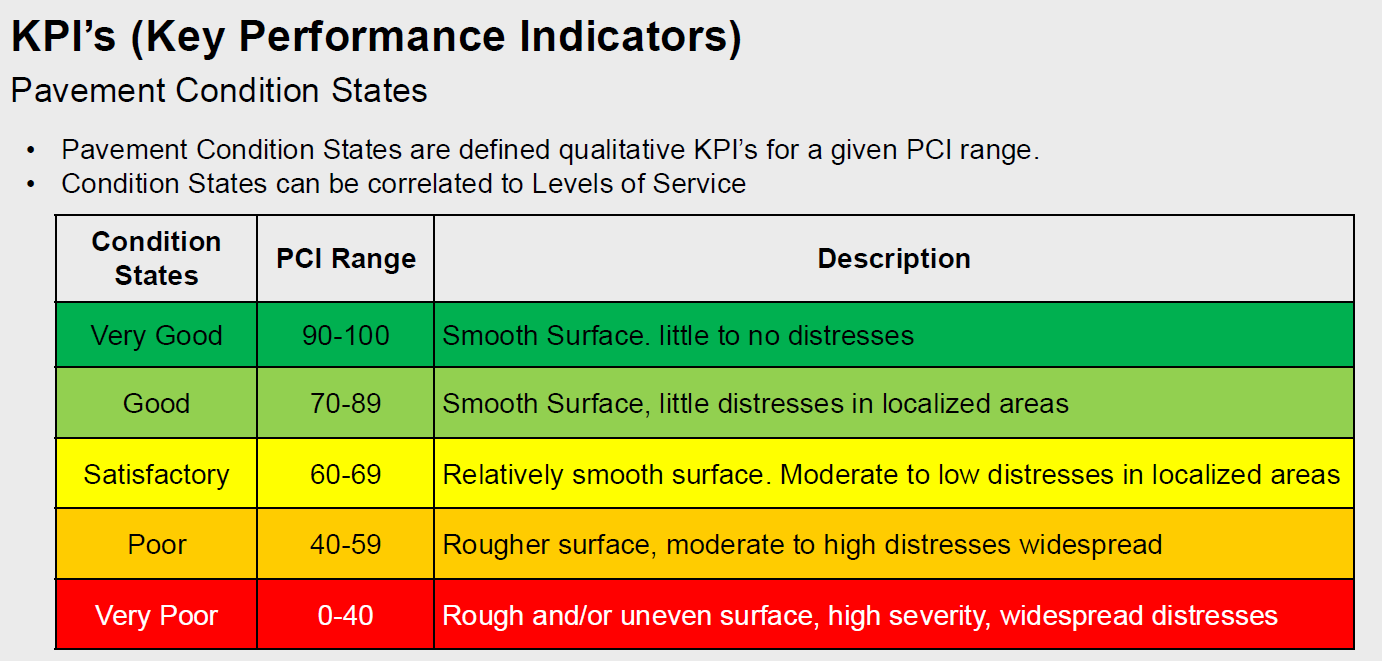
Seems pretty simple.. Green = good. Orange/Red=bad.
Where do our roads land on this scale. Umm.. Not good
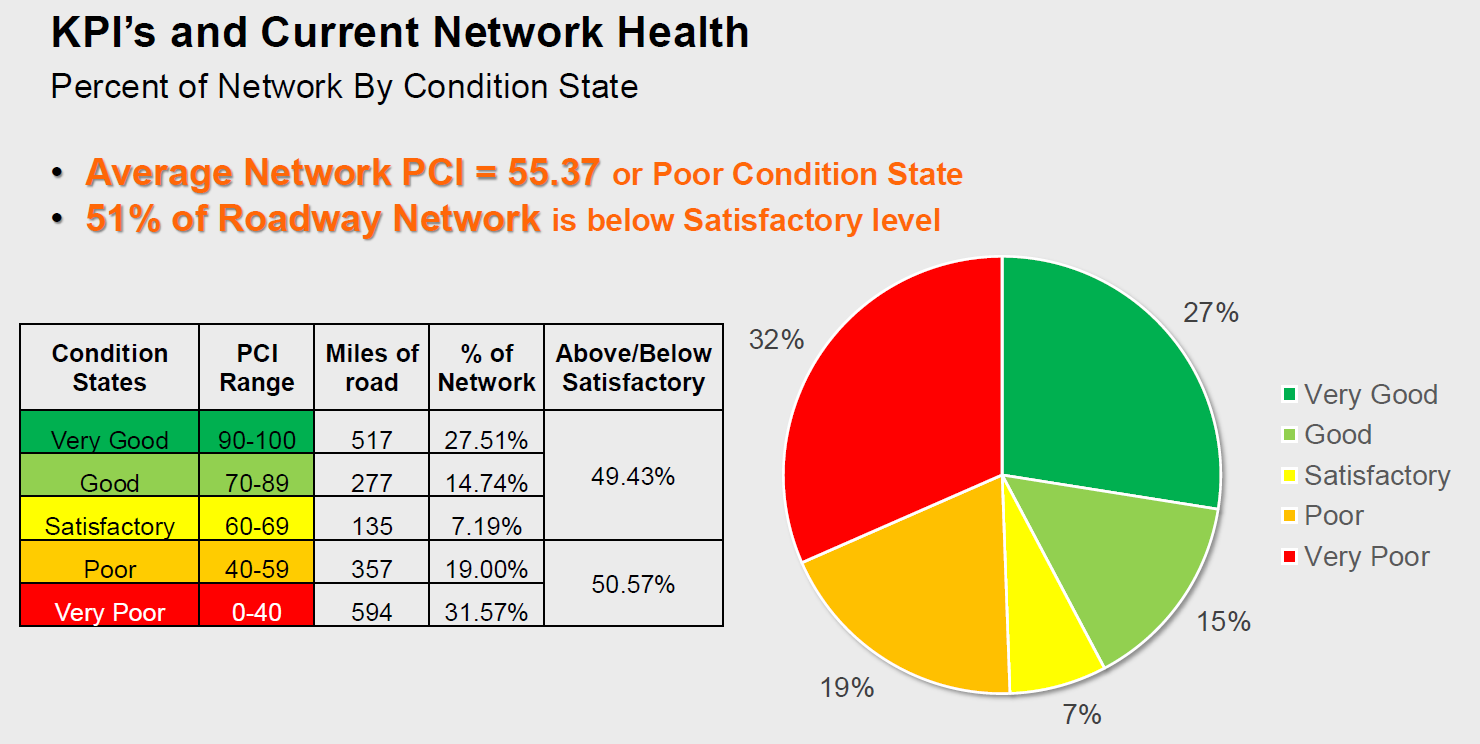
51% of our roads are in Poor or Very Poor condition. An additional 7.19% are in Satisfactory condition. The remaining 42% are in Good or Very Good condition.
Ouch.
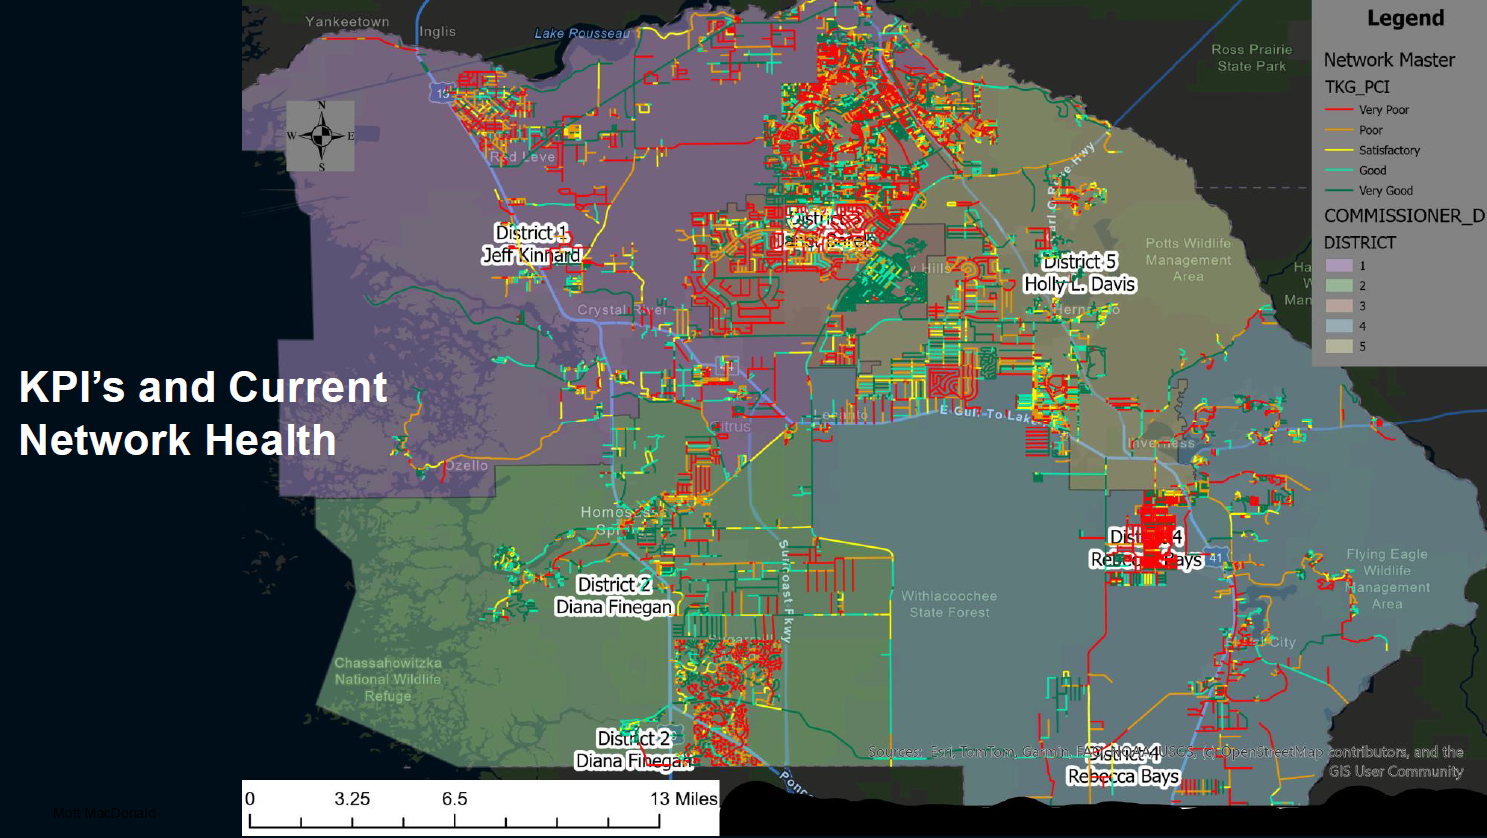
This shows a map of the entire county and shows the color coding of the road. I wish I could zoom in more, but not able to on this.
This chart breaks down each district and shows how many miles are in each category in each district.
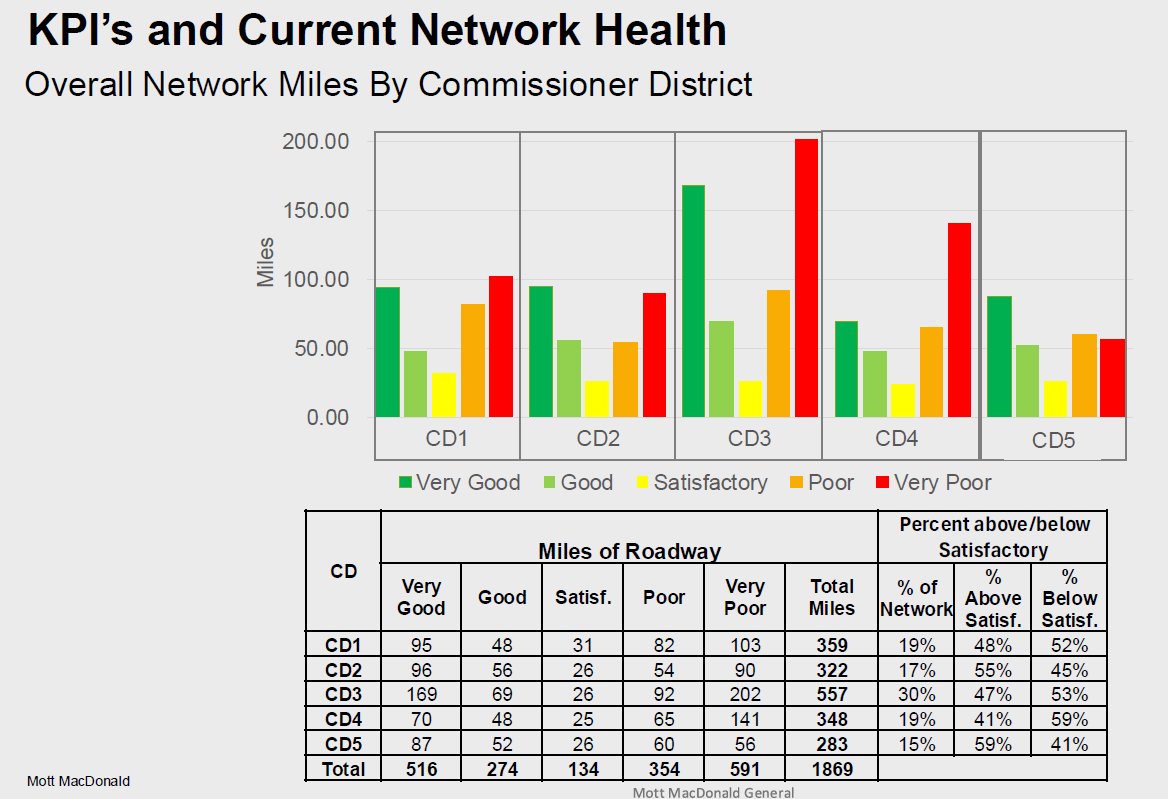
Not surprising, District 3 leads the pack with the most miles of Very Poor roads (202 miles). Ironically, this district also has the most roads in very good condition (169 miles)... but it also has the most miles. This is largely Pine Ridge and Citrus Springs.
District 4 follows with 141 miles in very poor condition. This is largely the Inverness Highlands, which notably has the highest density of homes in the district. There are so many roads in that section it just looks like a red blob. Most people in that district drive on very poor roads. I am sure they are thrilled.
If you look at the percentage of roads that are below Satisfactory, District 4 leads, followed by District 3 and then District 1.
District 5 has the highest percentage of roads over Satisfactory, with 59%. Inverness Villages IV will disagree with this, but the residents in Citrus Hills are largely happy.
And interesting observation.. The areas with higher home values (Pine Ridge and Sugarmill Woods aside) largely have better roads than areas where home values are a bit less. The exception is the old Beverly Hills areas on the east side of 491, which have very good roads.
A lot of green around Kings Bay, Dixie Shores, Citrus Hills, Bay Meadows, Riverhaven, and Mason Creek.
There is a bit of density in those areas in each of those districts, so that is probably the reason as they used to use a density formula as they allocated funds to each district.. which explains Pine Ridge and Sugarmill Woods not being good due to larger lots, although Sugarmill has a bit of density. Home values are certainly higher for roads that are in better conditions, so no complaints if you live there.
Just for fun.. I wanted to see what the roads looks like where our commissioners live. Just to be clear.. I am not suggesting that they steer money to their roads or anything like that. Simply just curious is all.
District 1: Kinnard - Good
District 2: Finegan - Good
District 3: Barek - Very Poor
District 4: Bays - Satisfactory
District 5: Davis - Poor
Ironically, this follows the net worth rankings based on their Form 6 filings as well:
1) Finegan 2) Kinnard 3) Bays 4) Davis 5) Barek
Interesting huh?
On the road again... (cracking myself up again).
This slide shows the types of road we have in the county.
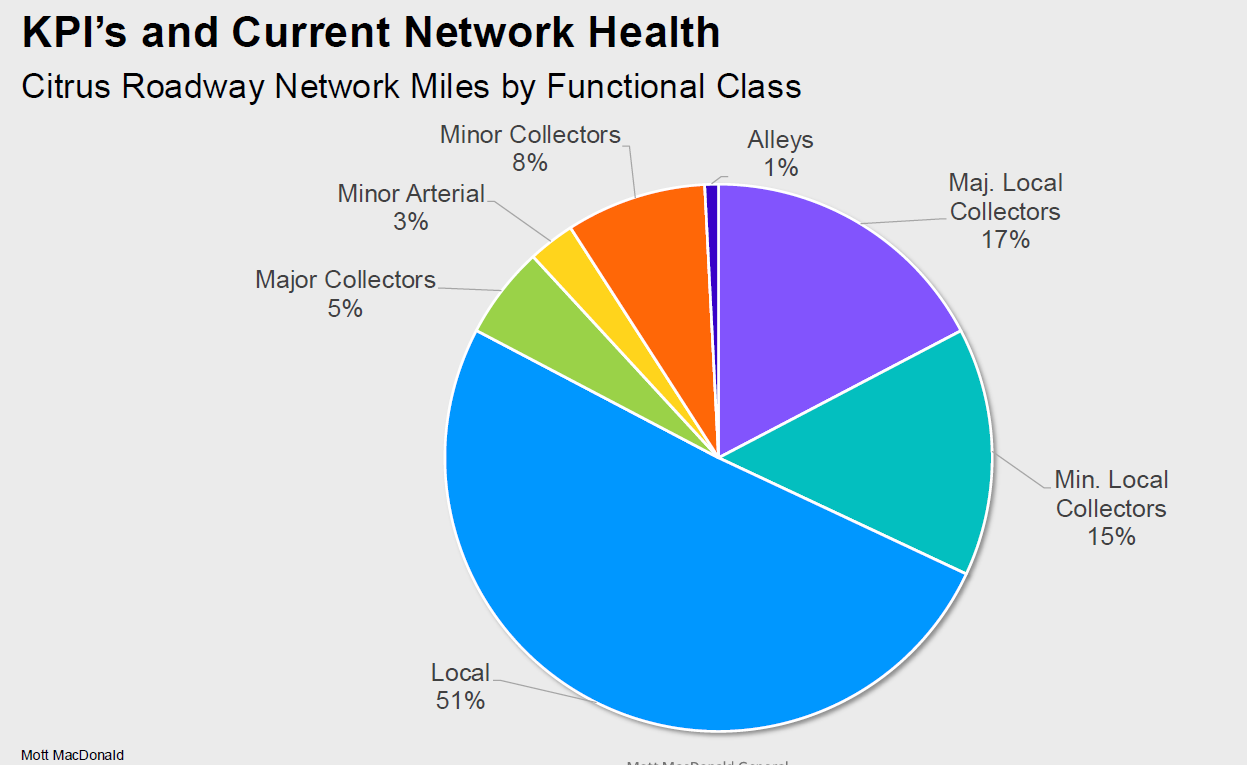
As you can see, residential roads (Local) are the majority of roads in the county.
This chart shows how the local roads are doing.
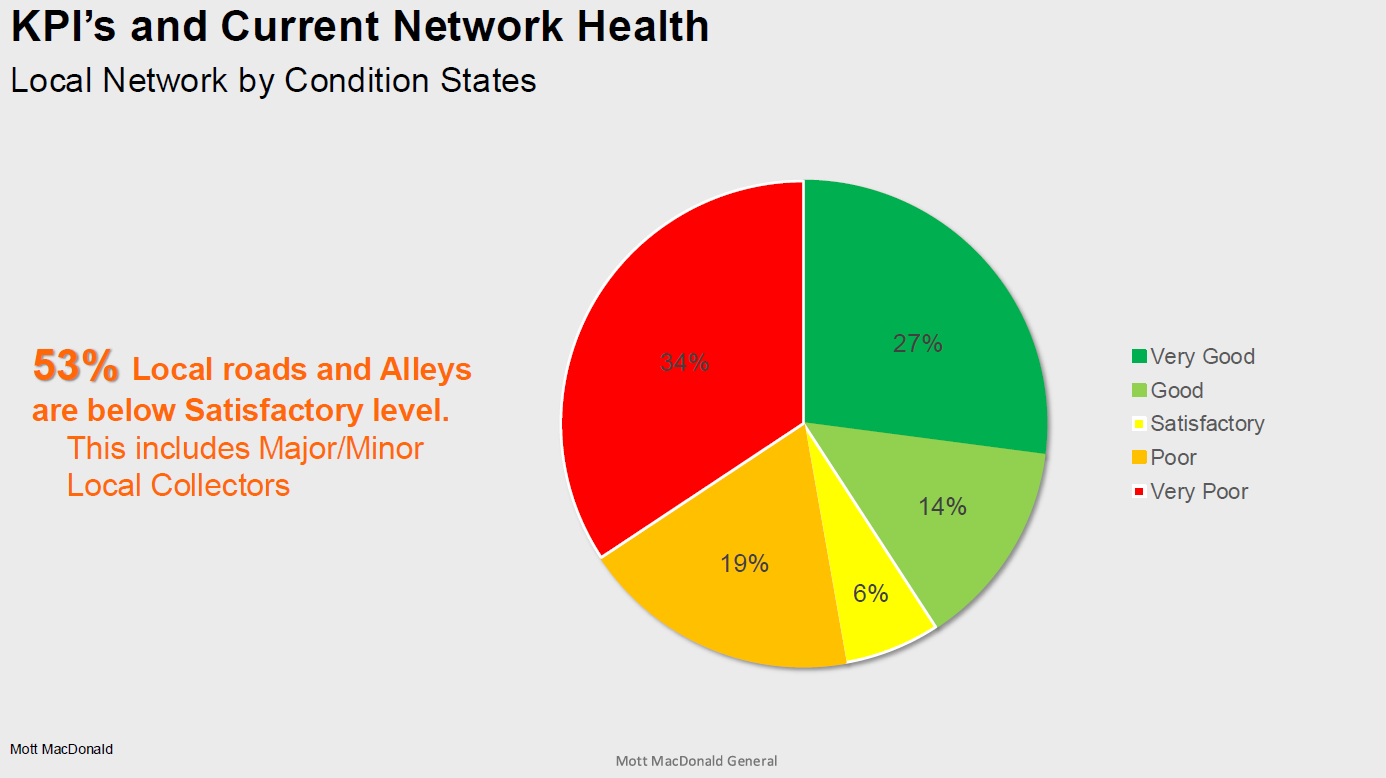
As you can see, 53% of local roads are below Satisfactory level, including the Major/Minor collector roads. Those are explained here.
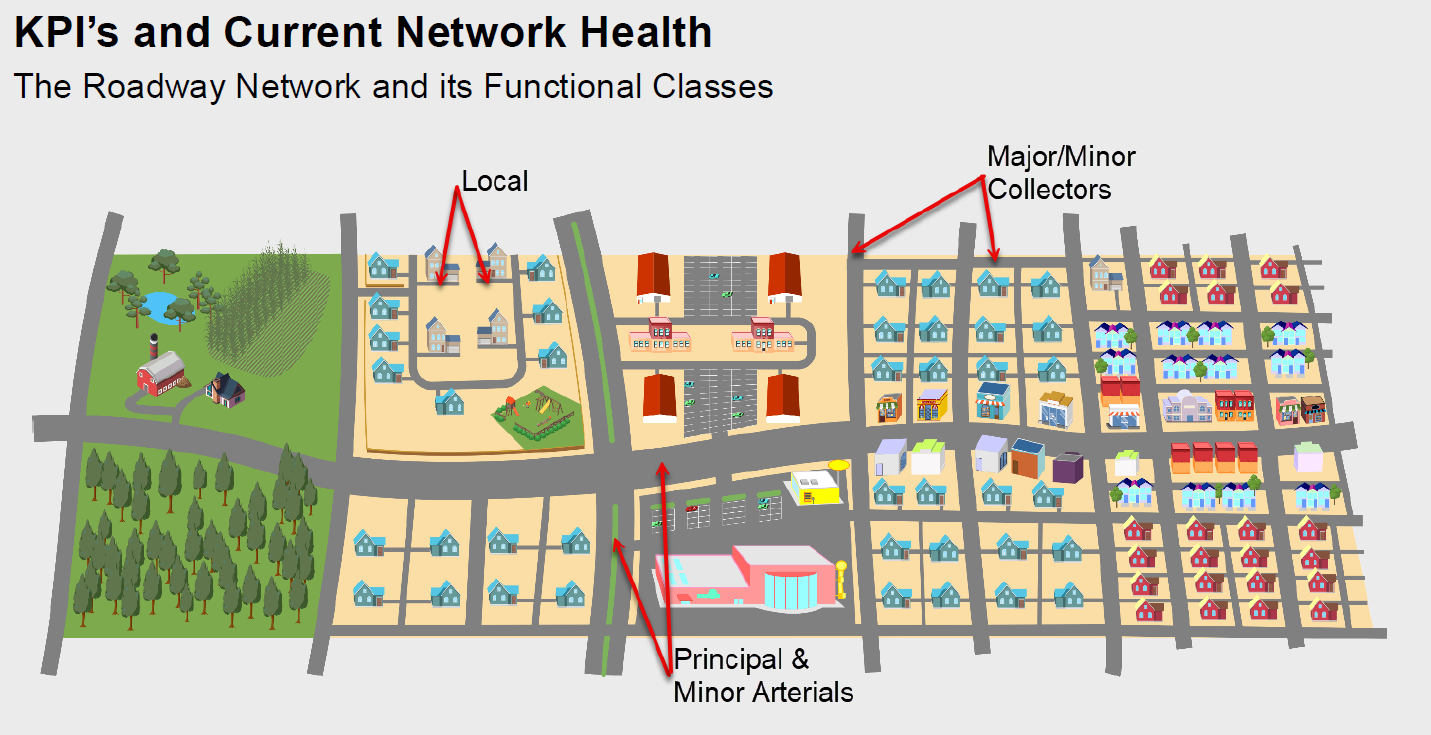
This shows the Arterial roads. These would be roads like 491.
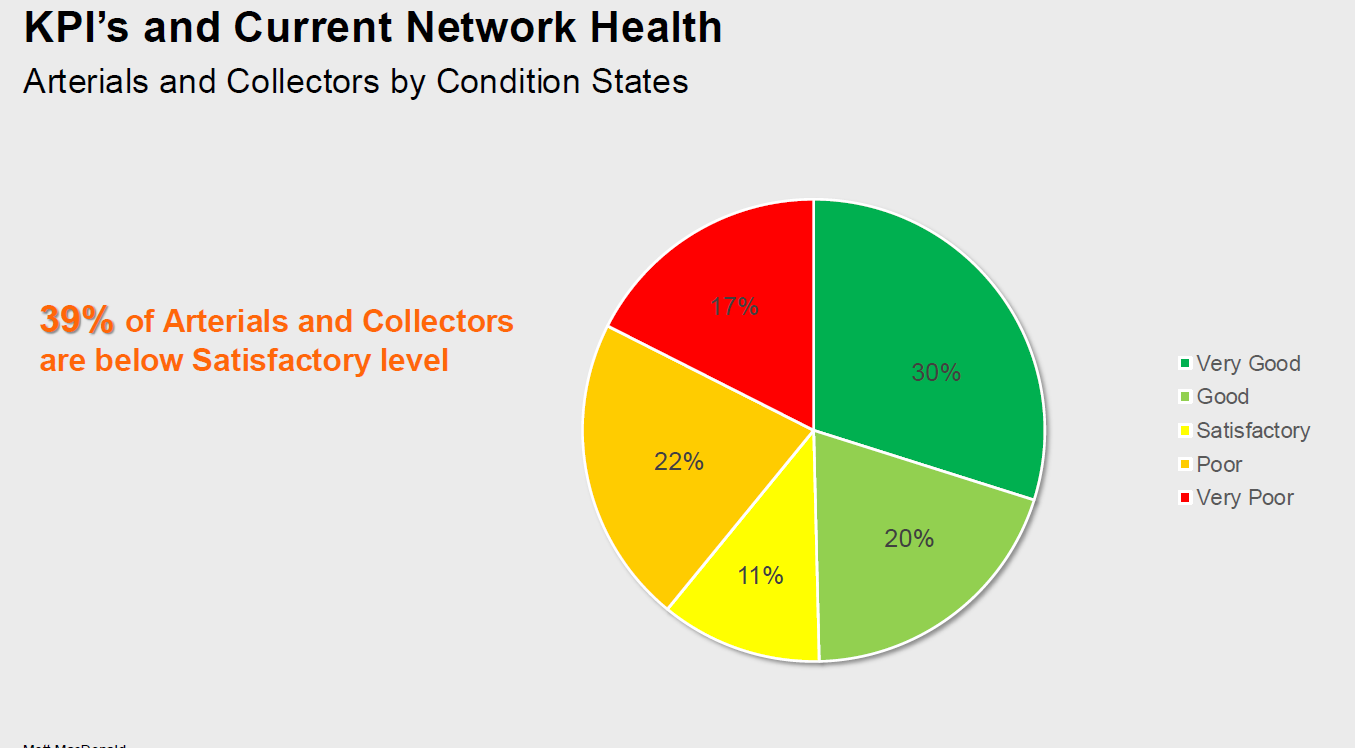
These are largely in good condition. So that is positive news.
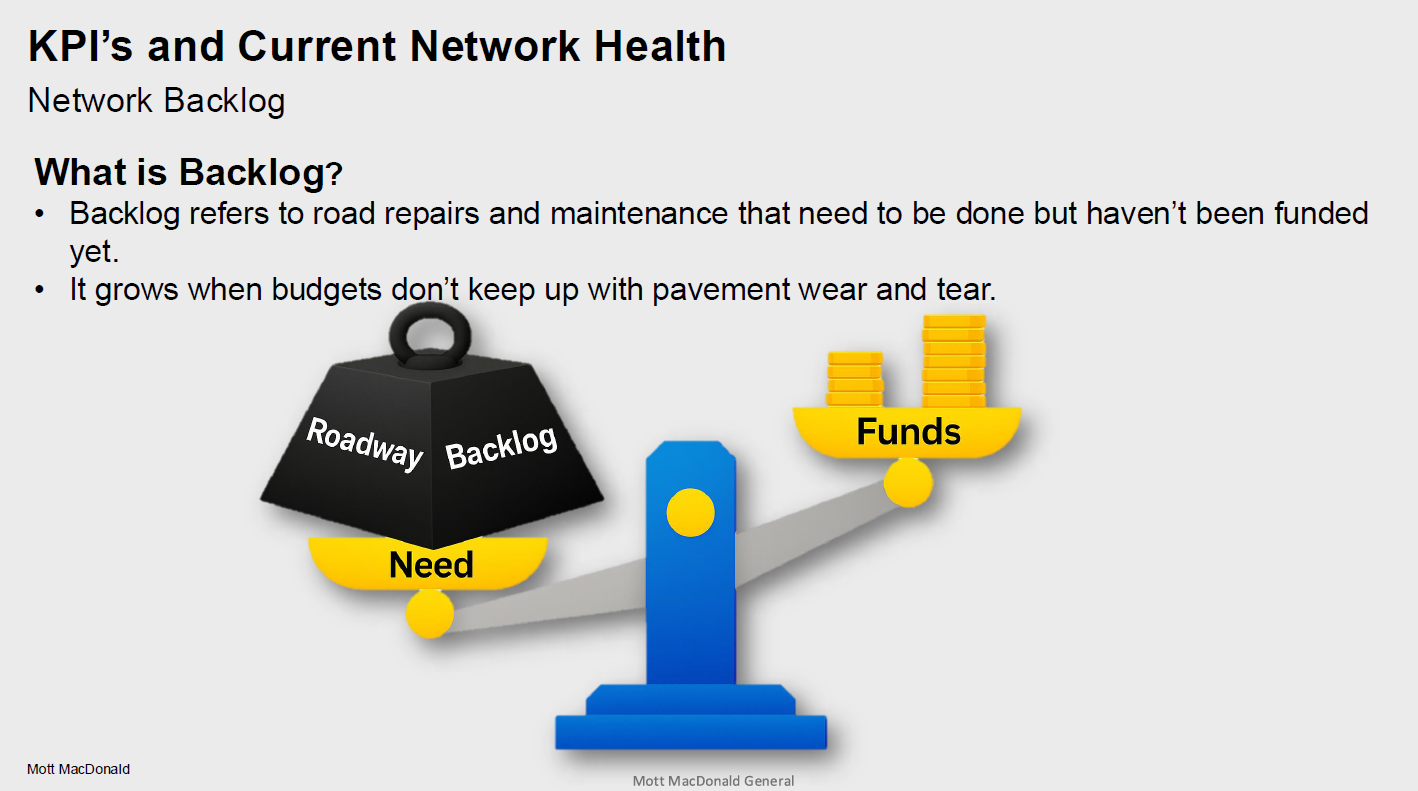
Next, we will talk about the backlog that we have. That is defined as roads that need to be done but no funding for them yet.
This chart shows the amount of funding needed to clear the backlog. That is a very big number... $714 million.. OUCH.
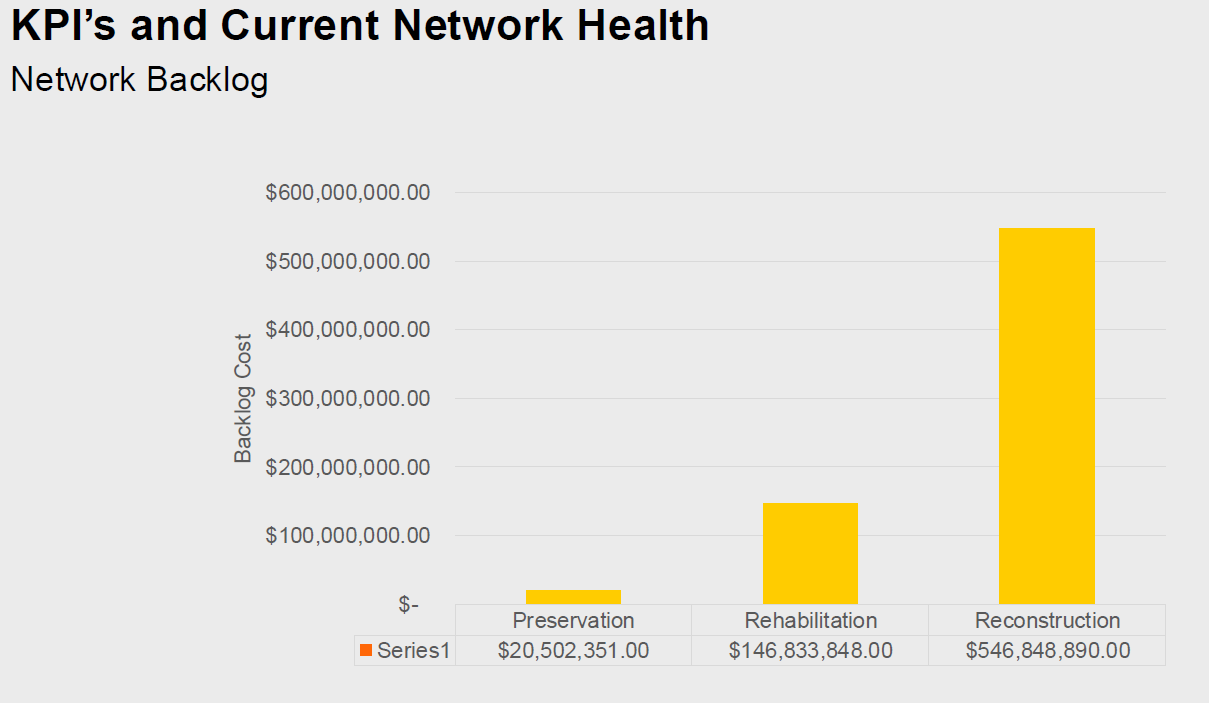
What is more scary... these numbers do not include inflation. This is based on today's costs/prices.
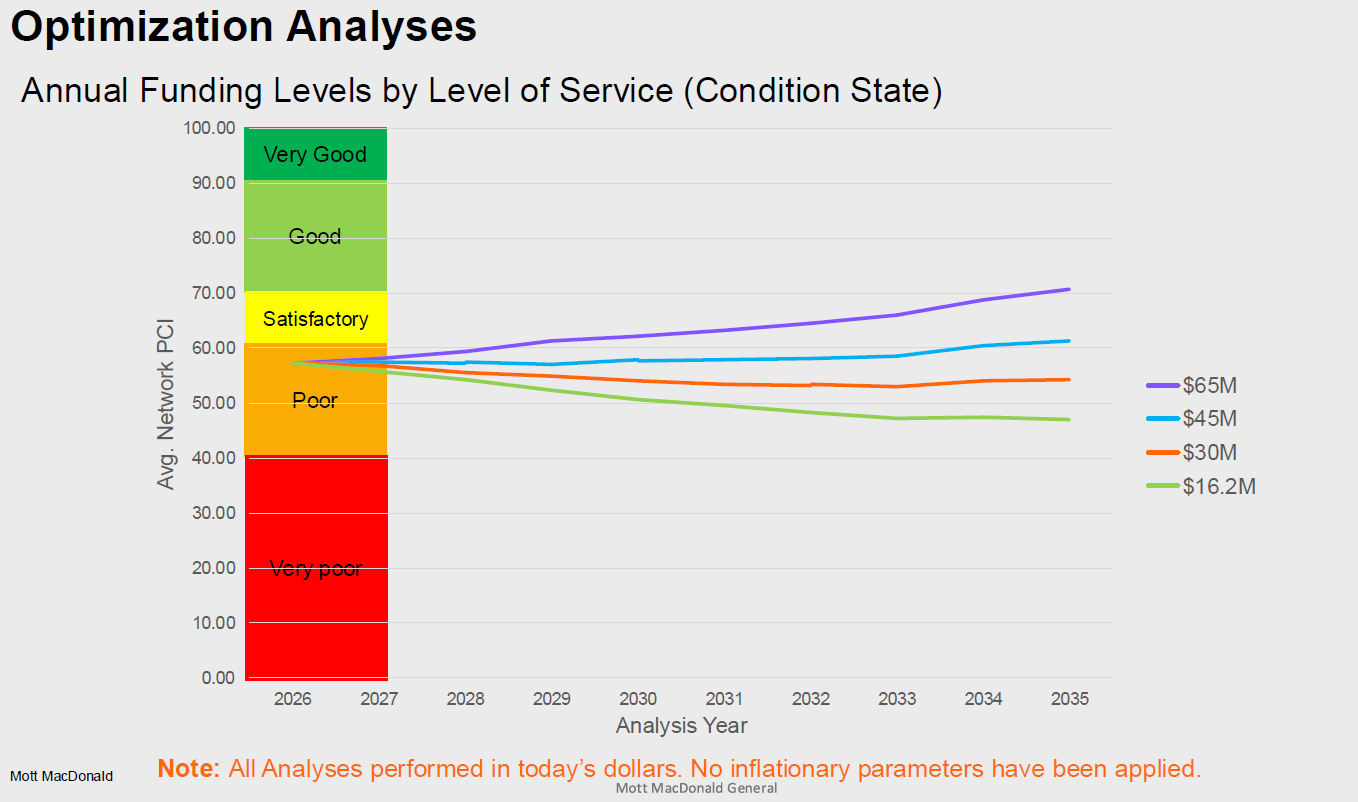
This is what it looks like at various spending levels. For instance, if we spend $45 million a year, it will take about 10 years to get our road average from Poor to Satisfactory. It takes about 4 years at $65 million a year.
So yeah.. that is bad. How did we get here?
Simple, past board decisions. You see, past boards did not prioritize roads. They spent money elsewhere or simply did things like opt our of transportation concurrency.
What is interesting is how much roads have changed over the years.
Here is a chart from the 2023 roads presentation.
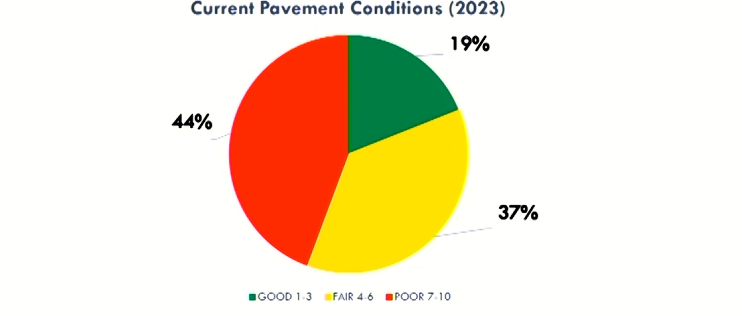
It shows "only" 44% of roads in Poor condition.... compared to 51% today. Granted, they are different companies and rating systems, but I tend to agree that roads are largely worse today than they were in 2023.
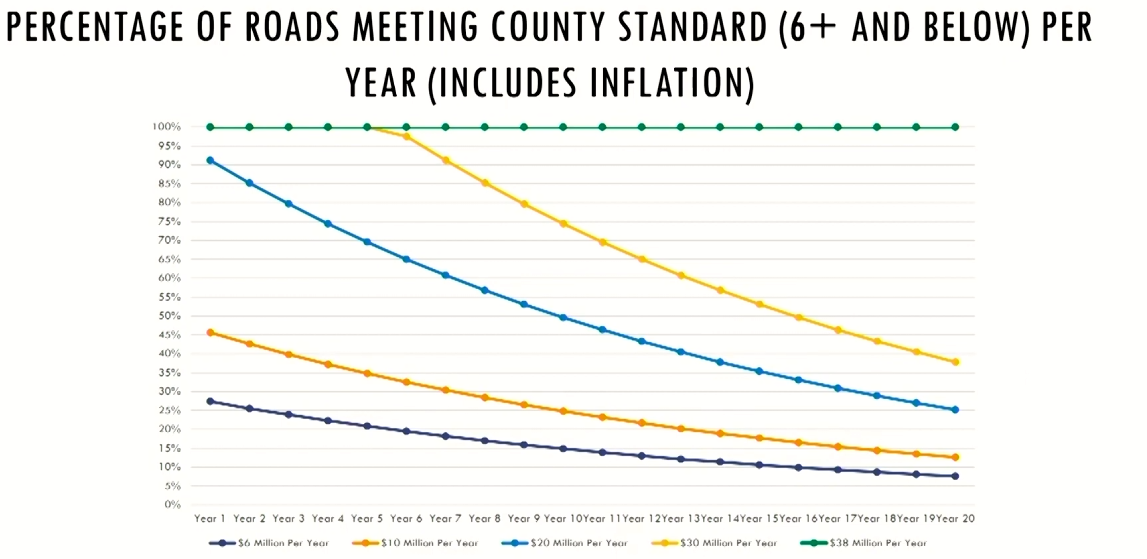
I know you cant read that very well, but this shows that it would take an estimated $38 million per year to maintain the roads (green link). Back then, we were spending $16m a year for that year and the next (purple line). Today, it is $65 million needed to address them. Another BIG difference.
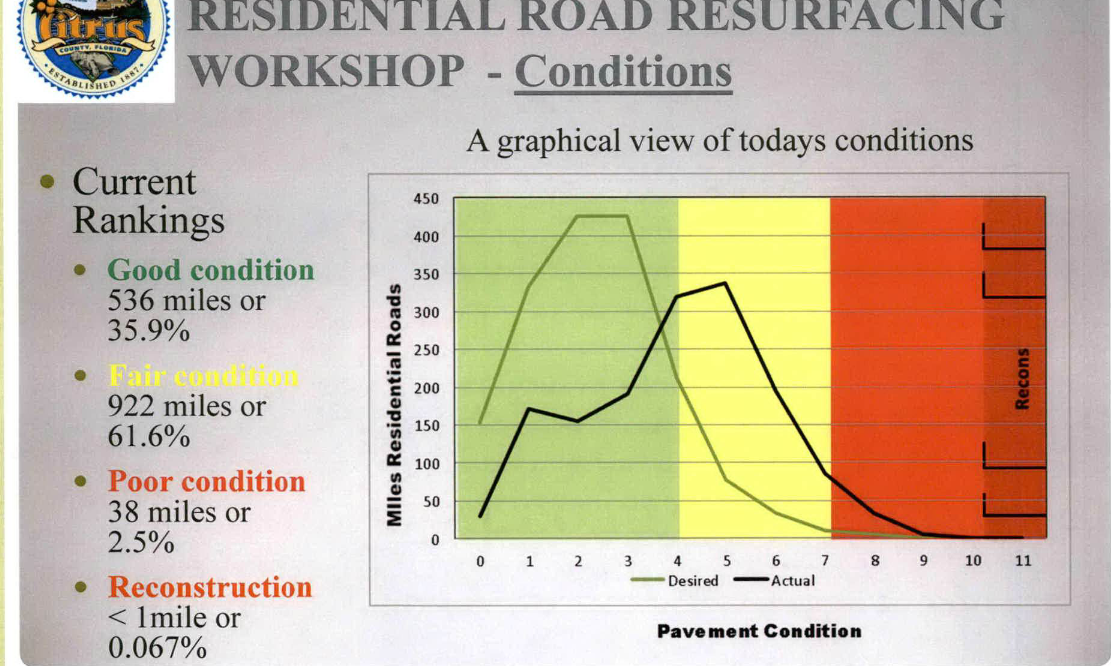
This is a flashback to 2015. This shows that only 2.6% or so of roads were in poor condition back then.
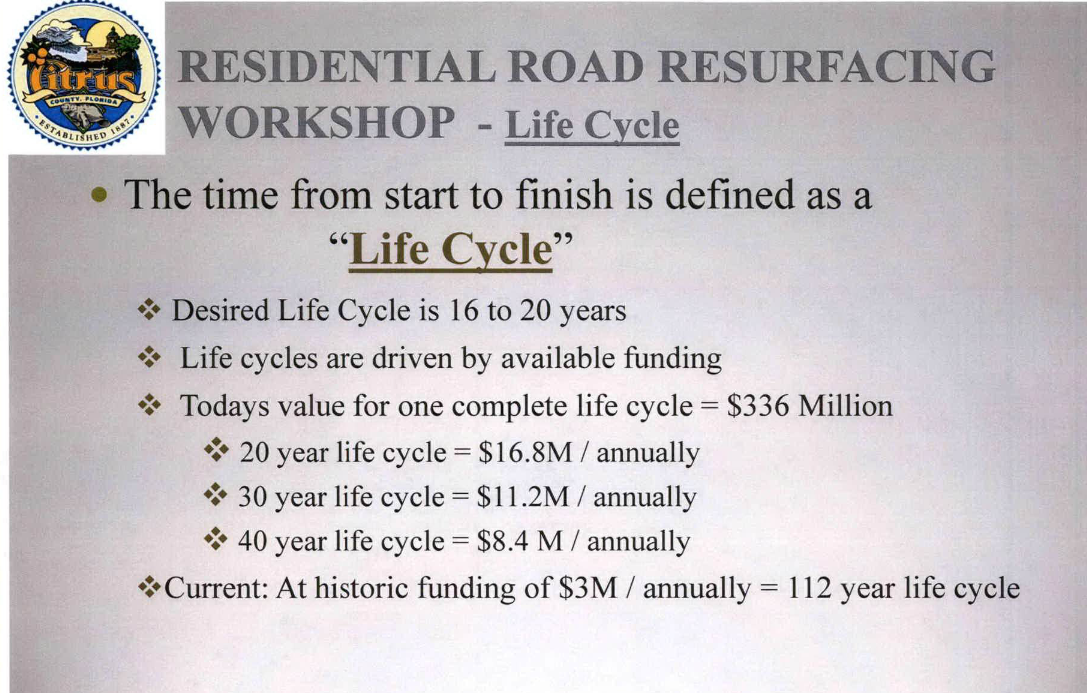
Even back then, they showed about $16.8 million needed annually to get roads on a 20 year cycle. The amount spent back then was $3 million per year. This shows the importance of a proper maintenance program. Had we spent the money we needed to back then to maintain the roads, we would not be where we are today.
It is clear, this county has NEVER prioritized roads. We largely relied on the gas tax to do it and did not add much, if anything since those were last implemented in 2006 (except for 2024 and 2025). Then we tied a large portion of the gas tax revenue to the expansion of 491 and 486... which could have been paid by the growth with impact fees or transportation concurrency, had we never opted out. Although those combined would still likely not be enough for those projects.
Now we are here today, facing a $714 million shortfall and ZERO plan to address it, aside from getting voters to go along with the sales tax. It would be nice if the county implemented a mobility plan of some type. That should have been done when we opted out of transportation concurrency back in December 2011.
However, with these new tools, we may finally be able to put a good plan together to address it. We certainly have no excuse not to do it now.
Another reason why we should tap the brakes on the sales tax talk and allow staff the opportunity to build a plan utilizing these new tools and present that to the BOCC for discussion. Then they can talk about finding ways to pay for it all. I think the community may be more open to embracing that idea.